
Activities
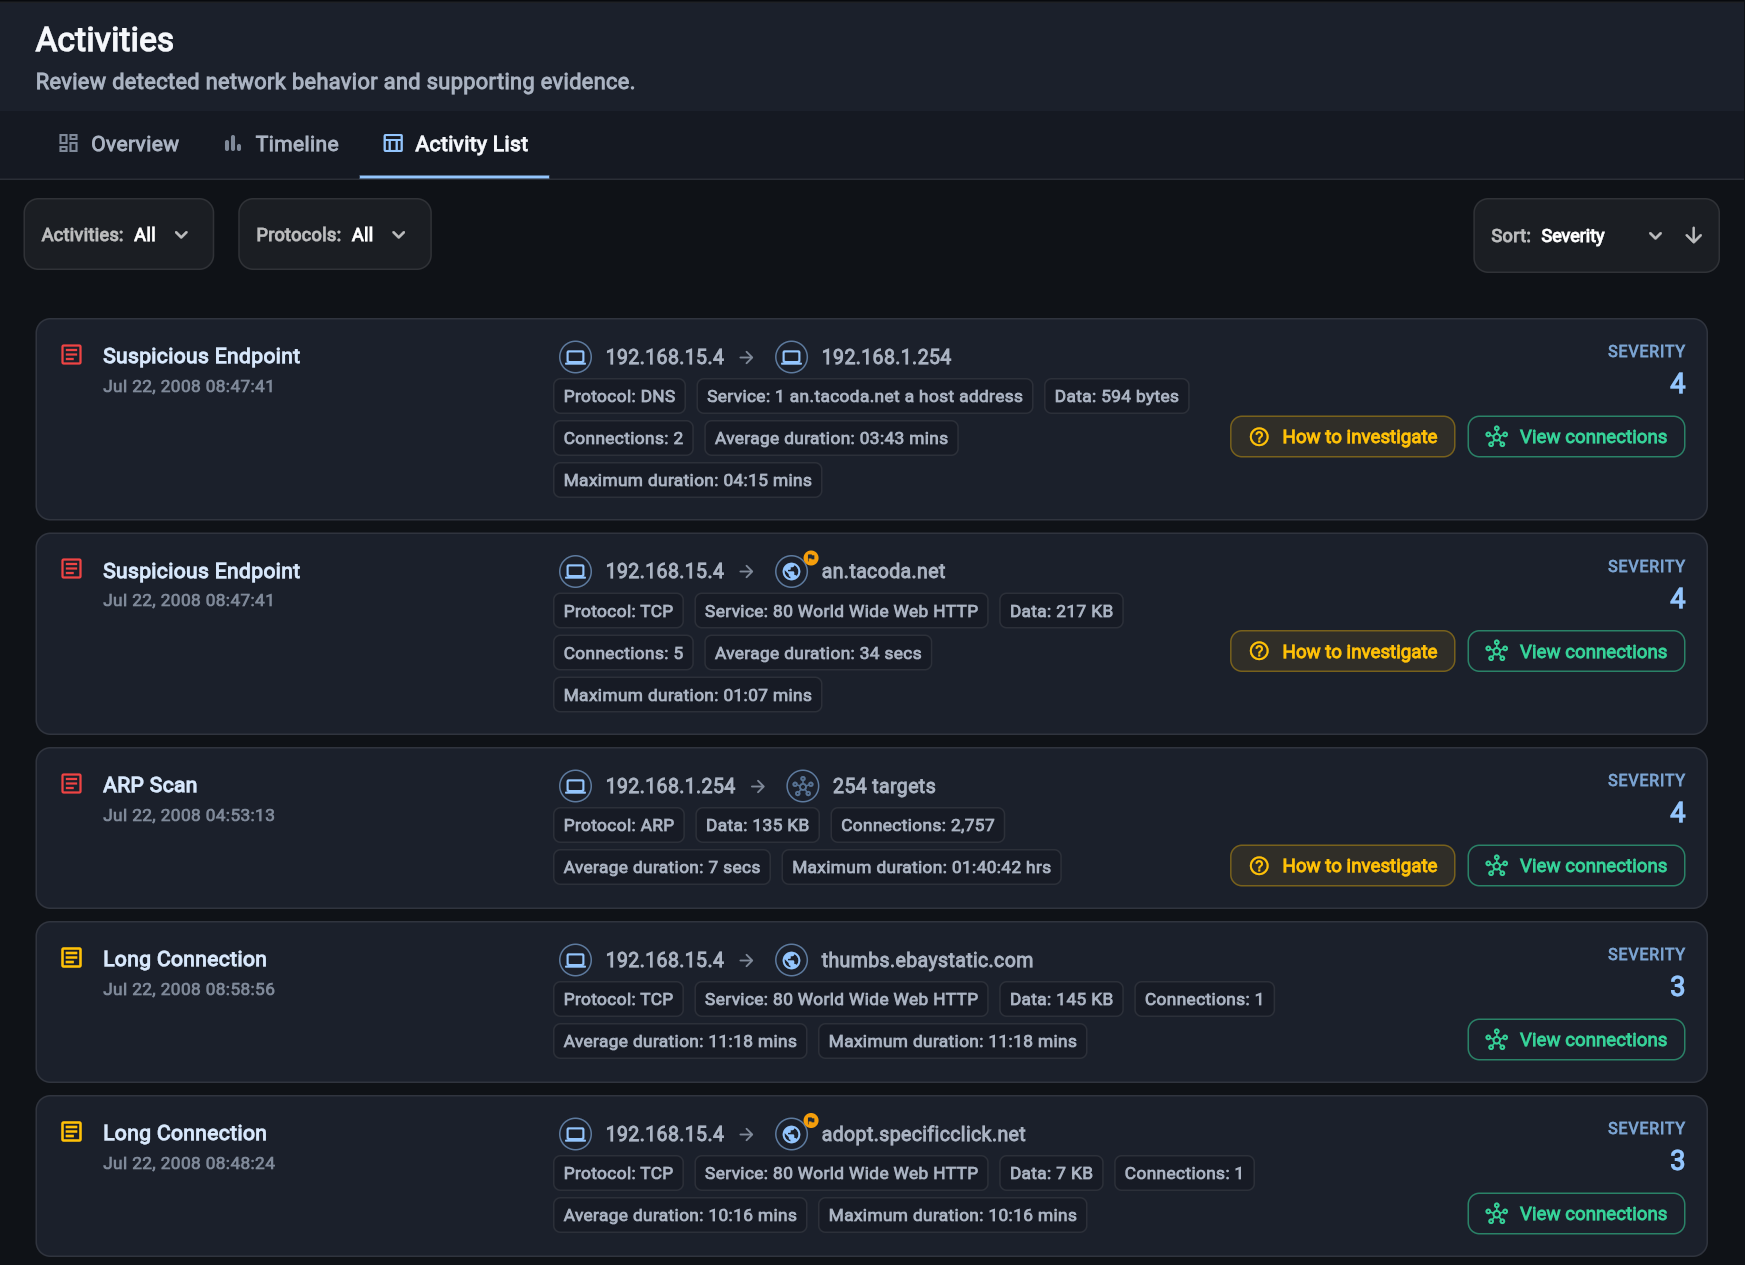
Surface suspicious and noteworthy behavior, with the evidence behind every detection.
View exampleCatch hackers. Red handed.
Analyze a PCAP or monitor live traffic in Red Hand Analytics, where activities, endpoints, DNS, flows, and connections come together in one investigation.

Red Hand Analytics
Start with a finding, then move through the endpoints, requests, traffic, and connections that explain it without losing context.
Surface suspicious and noteworthy behavior, with the evidence behind every detection.
View exampleSee who communicated, then add reputation, ownership, and threat-intelligence context.
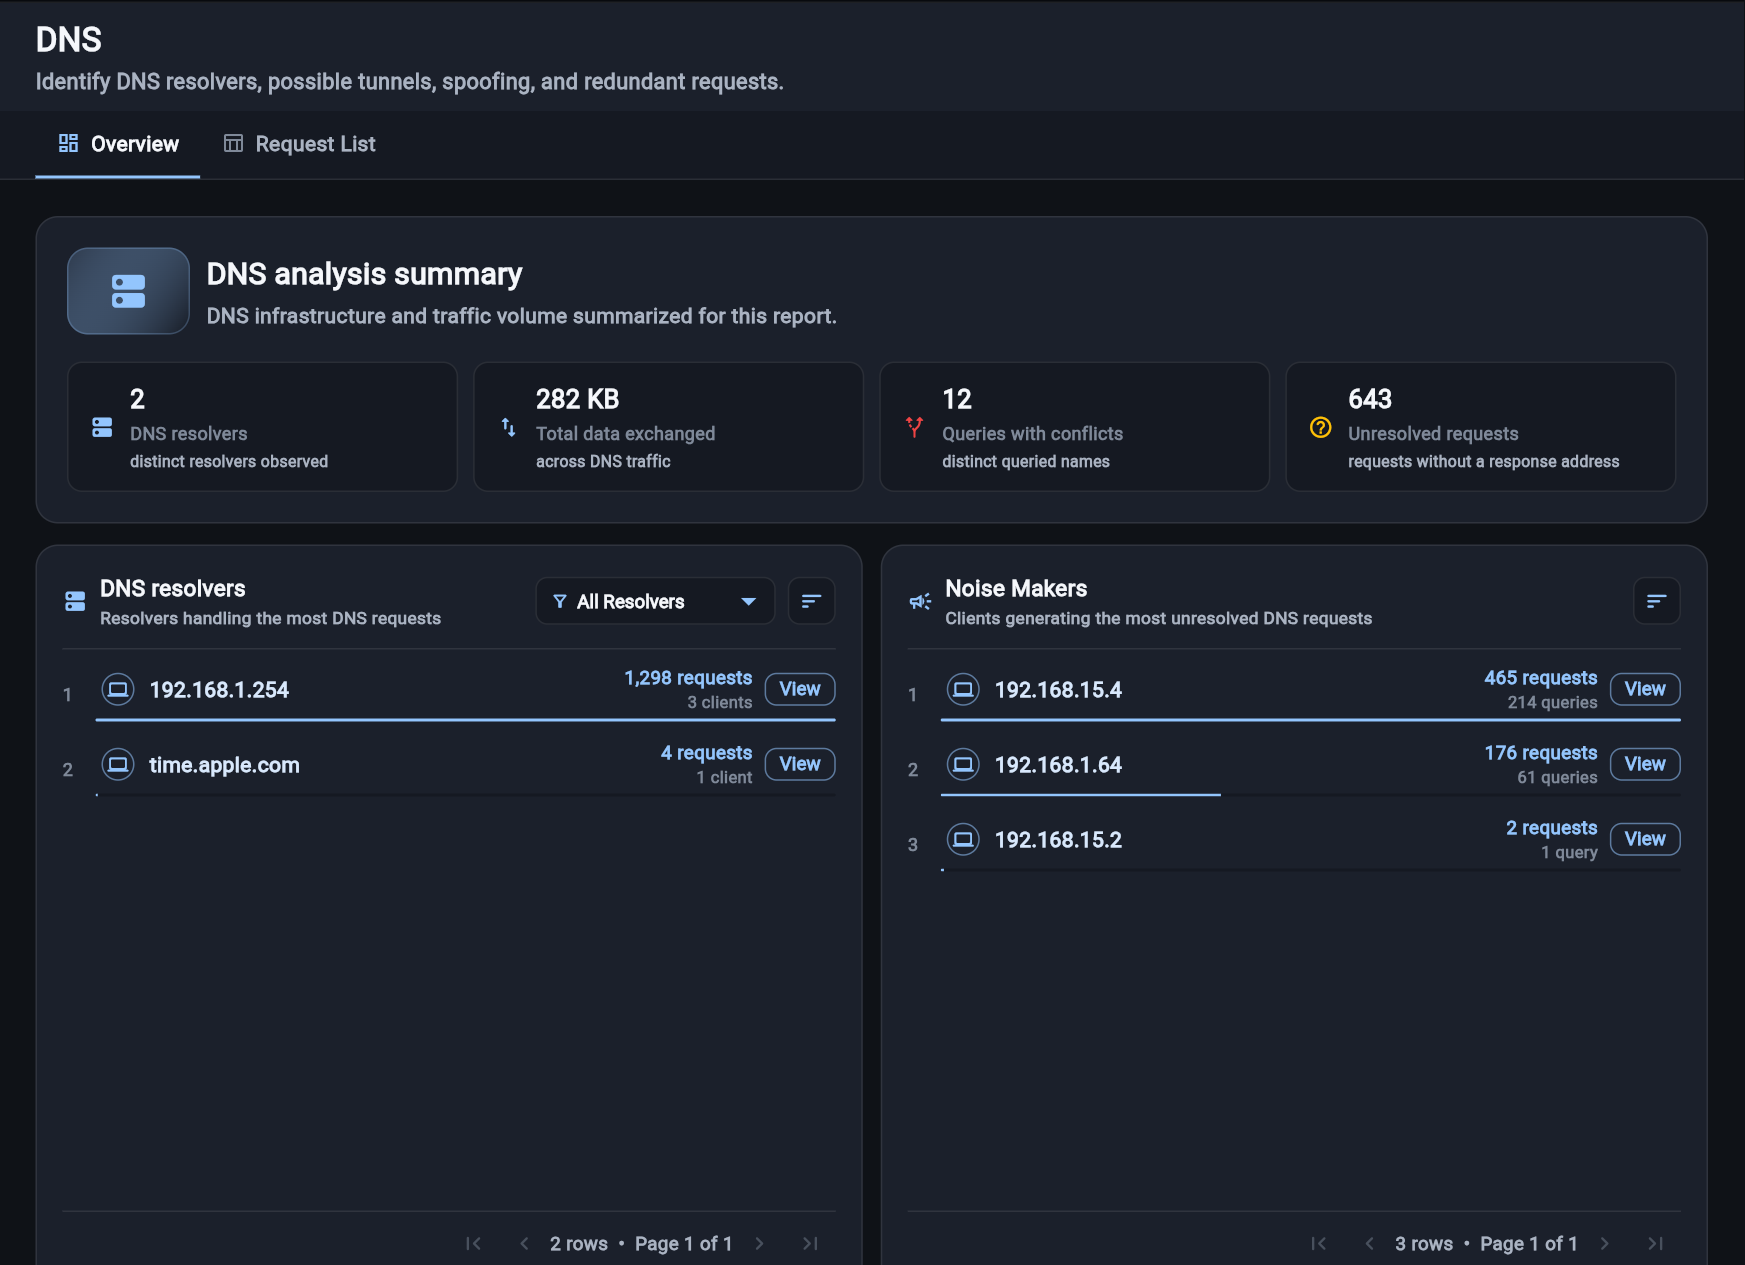
View exampleReview resolvers, noisy clients, unresolved requests, conflicting answers, and unusual DNS data exchange.
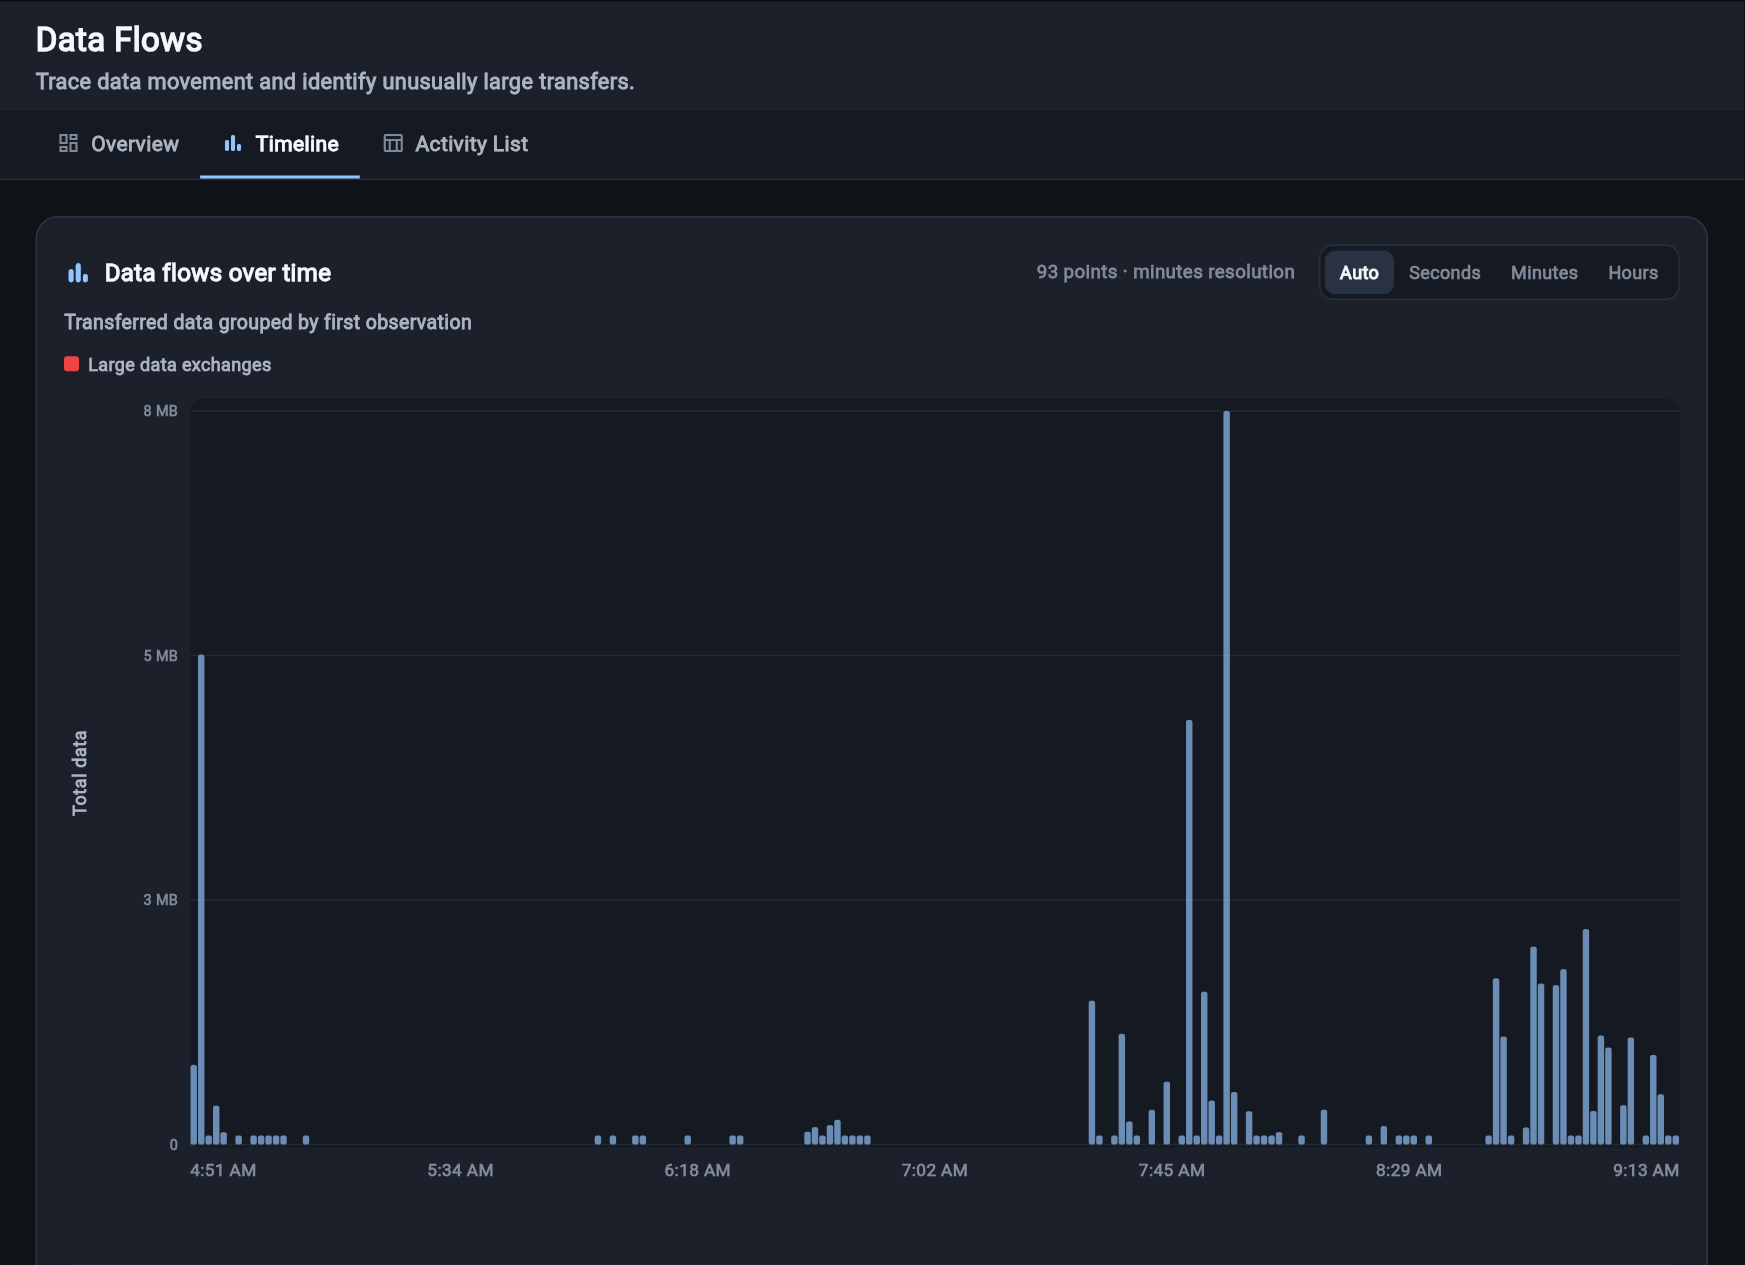
View exampleFollow upload, download, and internal traffic to identify unusually large transfers.
View exampleFind repeated and long-running communications that isolated events can hide.
View exampleFilter, sort, and inspect the individual connections behind each observation.
View exampleTwo ways into Red Hand Analytics
PCAP Analyzer and Red Hand Collector feed the same investigation experience. Choose based on how you have the traffic and how long you need to observe it.
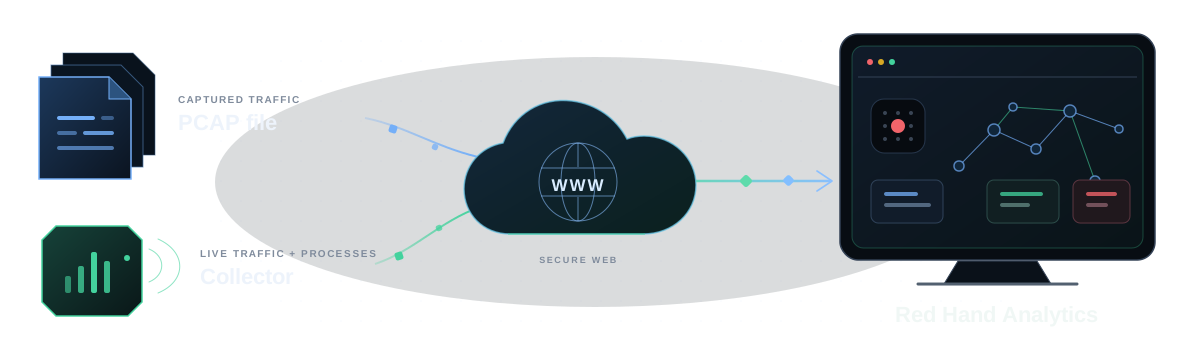
| Choose your inputWhat changes | CollectorContinuous visibility | PCAP AnalyzerAnalyze a capture |
|---|---|---|
| Analysis experienceActivities, endpoints, DNS, flows, and connections remain connected. | Red Hand Analytics | Red Hand Analytics |
| Observation windowHow much time the analysis can cover. | Continuous | Snapshot in time |
| Process visibilityIdentify the application responsible for a connection. | Yes | No |
| DeploymentWhat is needed before analysis begins. | Lightweight endpoint installation | No endpoint installation |
Product changelog
Meaningful new capabilities and improvements, with a direct path to try each one.
The new 4–5 MB Rust Collector adds protocol inspection, executable fingerprints, and improved process attribution, with x11 less CPU and nearly x6 less memory in testing.
Read updateThreat intelligence v3 replaces a dominant aggregated feed with about 145 original sources, preserving source context while removing stale and shared-infrastructure indicators.
Read updateAs more people use Red Hand Analytics, we are introducing a few limits for anonymous uploads to help keep free PCAP analysis reliable and available to everyone.
Read updateContact
Have a question about a capture, Red Hand Collector, or Red Hand Analytics? Send us a note.
You’ll hear directly from the Red Hand team.