01
Activities and evidence
Review suspicious and noteworthy behavior, then open the exact connections behind a finding.

Packet capture analysis
Upload a PCAP and get a connected investigation, not just a packet dump. Explore activities, endpoints, DNS requests, data movement, and the connections behind every finding in Red Hand Analytics.
Choose a PCAP or PCAPNG file to begin an investigation.
or drop a file anywhere in this area
Raw captures are deleted after processing. Anonymous reports are temporary; free-account reports are kept for 14 days. Create a free account.
Behavior-based detection and integrated threat intelligence surface what matters, so you can examine the evidence from different angles and reach a confident conclusion.
Review suspicious and noteworthy behavior, then open the exact connections behind a finding.
Understand who communicated and add domain, ownership, reputation, and threat-intelligence context.

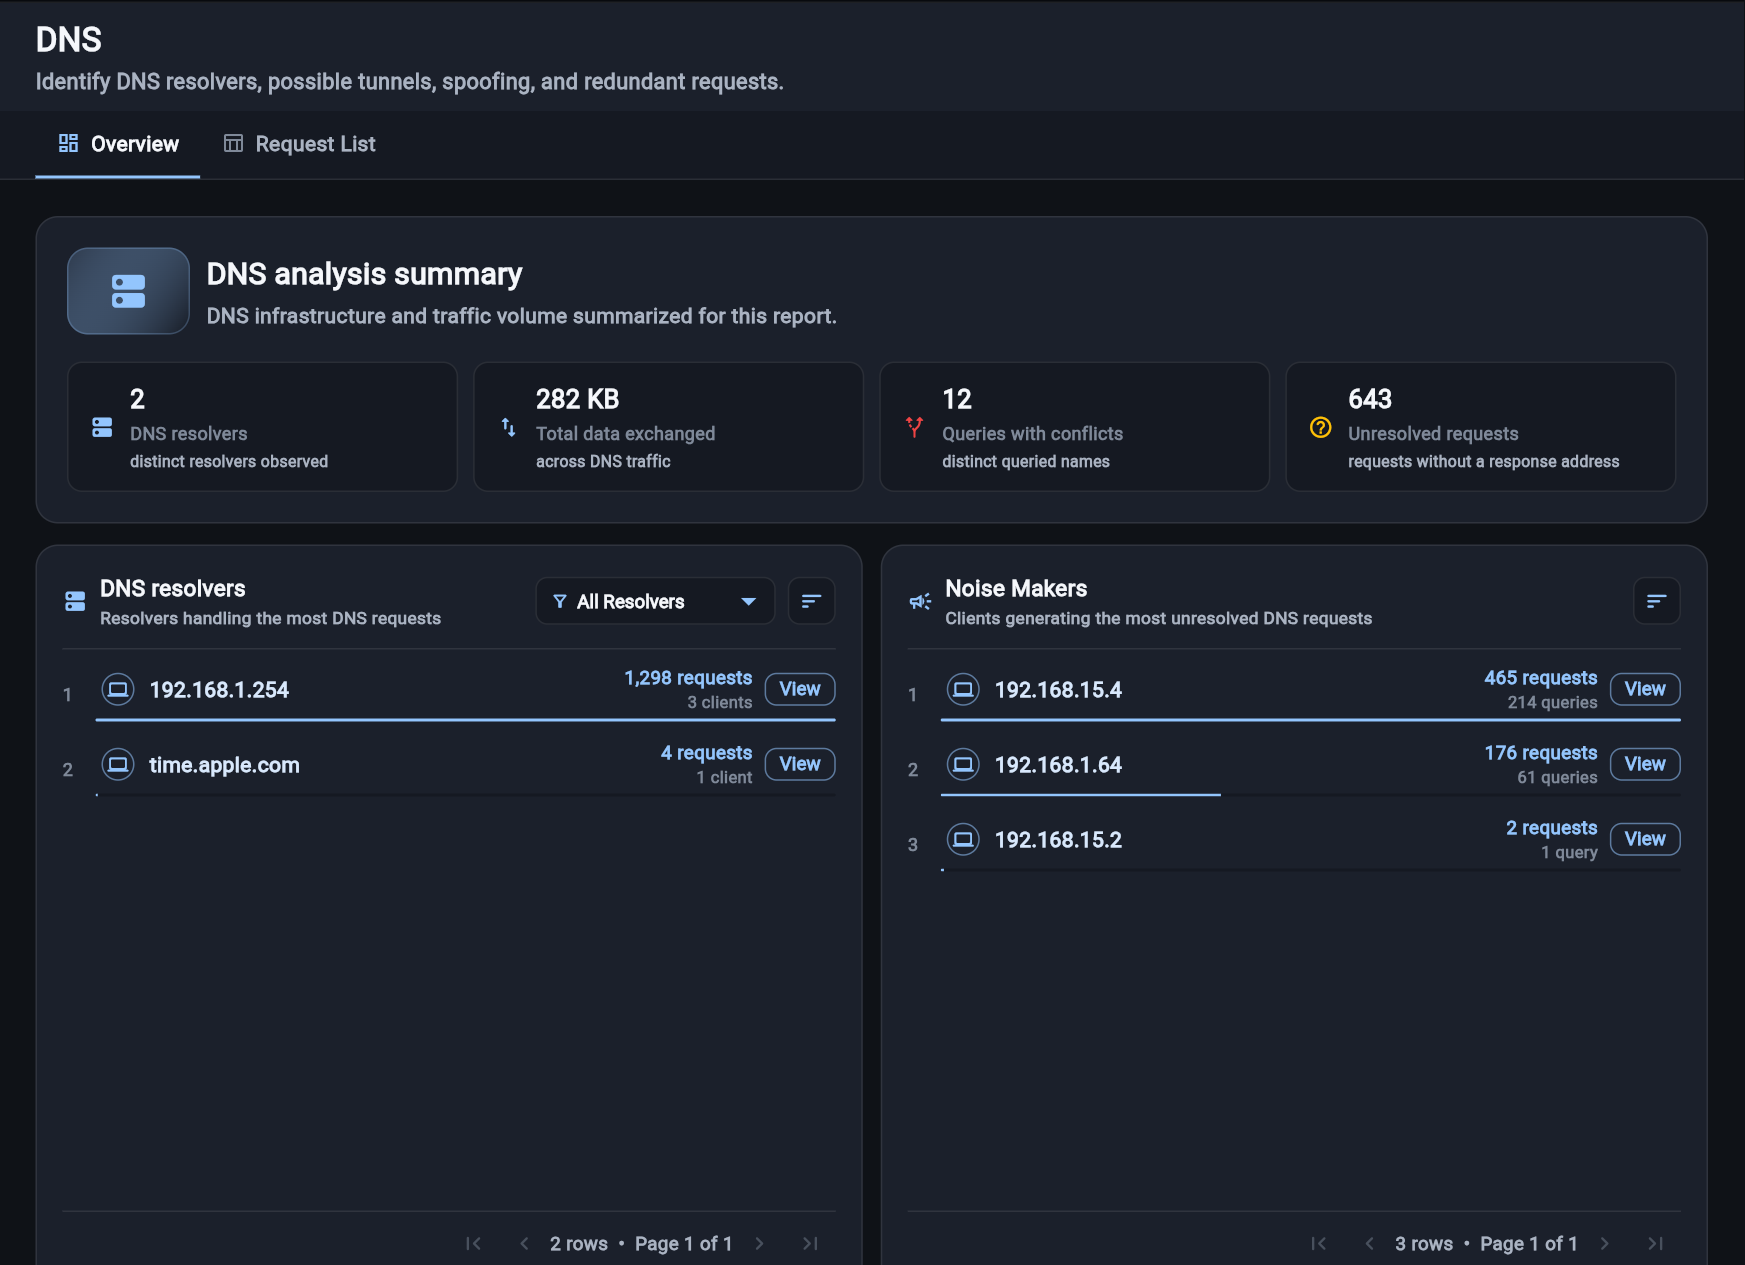
Trace DNS behavior and data movement, then filter and inspect the connections that explain them.
Use the commands below to record network traffic with tools included with Windows and macOS, and commonly available on Linux.
Open Command Prompt or PowerShell as Administrator. Replace <id> with the interface ID identified below.
Run ipconfig /all and note the MAC address of the adapter with a Default Gateway. Match that address to an interface ID from pktmon list.
pktmon start -c --comp <id> --pkt-size 0 -s 100 -f cap1.etl-s 100 limits the capture file to 100 MB and --pkt-size 0 records full packets.
When you have captured enough traffic, run:
pktmon stop
pktmon etl2pcap cap1.etl --out cap1.pcapngcap1.pcapngThe packet capture is saved in the current terminal directory.Open a terminal and replace <interface-name> with the network interface identified below.
The interface following dev in the default route is usually the interface you need.
ip route | grep defaultsudo tcpdump -vni <interface-name> -s 0 -w capture.pcap -c 100000-s 0 captures complete packets. The capture stops after 100,000 packets; press Ctrl+C to stop it sooner.
capture.pcapThe PCAP file is saved in the current terminal directory.Open Terminal from Applications > Utilities and replace <interface-name> with the network interface identified below.
The final value on the normal default route is usually the interface you need, such as en0.
netstat -nr | grep defaultsudo tcpdump -vni <interface-name> -s 0 -w capture.pcap -c 100000Enter your password when prompted. Press Ctrl+C to stop before 100,000 packets.
capture.pcapThe PCAP file is saved in the current terminal directory.Upload a PCAP or PCAPNG file to explore activities, endpoints, DNS requests, data flows, and their supporting connections.