AWS VPC Flow Logs - Step by Step Tutorial
See also: Netflow vs. PCAP (Packet Capture).
See also: Netflow vs. PCAP (Packet Capture).

If capturing raw network traffic across your entire cloud environment, a specific VPC, or even just a few instances is beyond your budget, storage capacity or technical foo, major cloud providers offer a more cost-effective solution: VPC Flow Logs. This feature significantly simplifies the process of acquiring network traffic data, providing essential network evidence without the need for manual traffic capture from multiple instances, avoiding the costs of traffic mirroring services (which, while available, can be expensive), and without straining your storage limits.
Flow logs provide a summarized, text-based description of network connections, primarily designed for TCP but also applicable to protocols like UDP, ICMP, and IGMP to some extent. Originally developed by Cisco over 15 years ago, NetFlow became an open standard for network logging, now widely supported by various vendors of switches, routers, and all major cloud providers. NetFlow typically logs details such as the protocol, source IP, source port, destination IP, destination port, timestamp, connection duration, total bytes, and packet count for each connection.
While VPC flow logs may lack some of the contextual and application-specific details available from raw network traffic, they still offer a valuable source of evidence for investigating network-related cyber activities, whether it's early reconnaissance attempts or later breach stages like command-and-control connections and data exfiltration.
Flow logs defined at the VPC level apply to all subnets and ENIs in the VPC, while subnet-level logs apply to all ENIs within that subnet. Logs defined for a specific ENI apply only to that interface.
Note: If an ENI is covered by multiple flow log definitions, it will collect and submit data separately according to each log's settings.
Before we define VPC flow logs, ensure you have the following:
Log in to your AWS Management Console, and from the Services menu, navigate to the VPC Dashboard. In the top-right corner, click the Actions button, then select Create Flow Log:
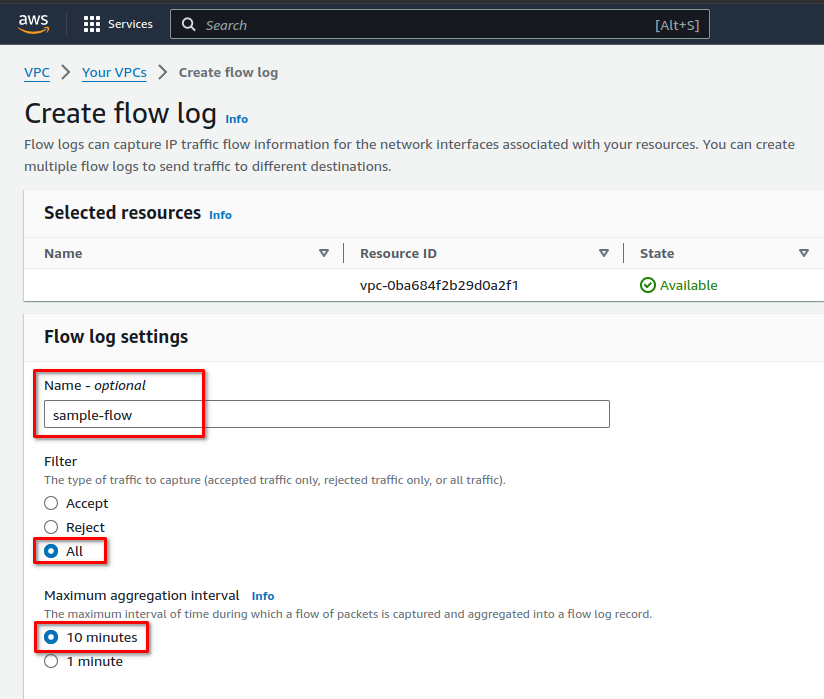
Next, name the flow log (optional, we’ve named it 'sample-flow'), set filter to All and Maximum aggregation Interval to 10 minutes.
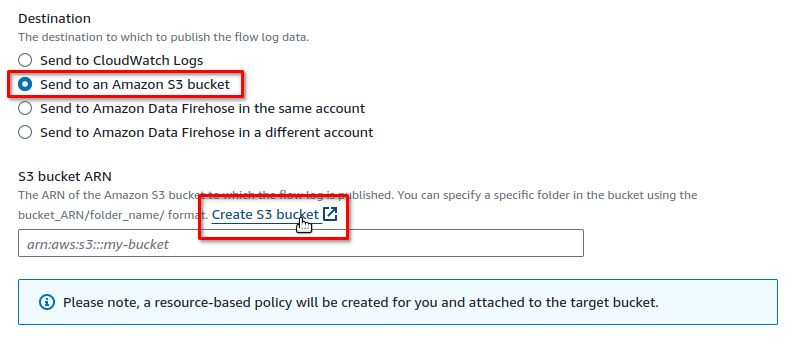
Next, configure the flow log destination by selecting Send to an Amazon S3 bucket. You can either create a new bucket or use an existing one. To create a new bucket, choose Create S3 bucket:
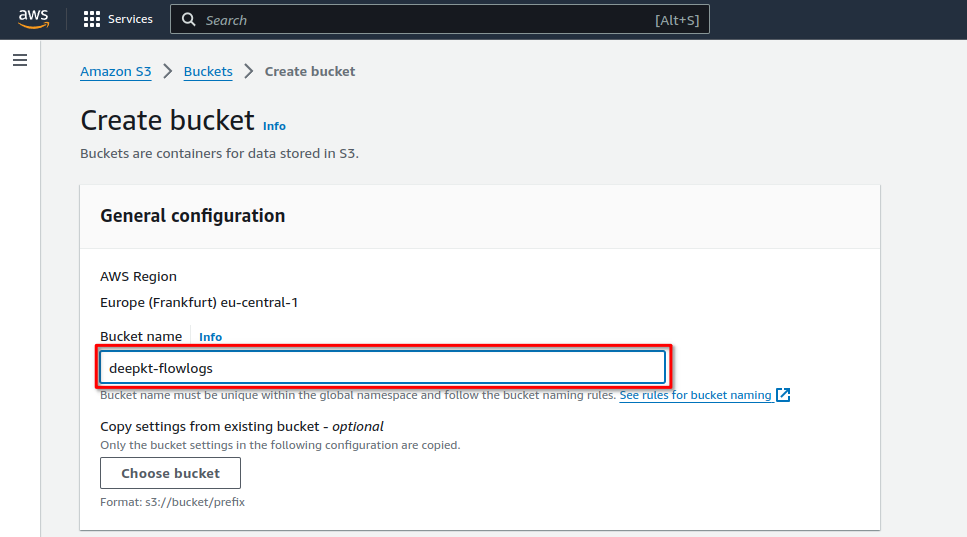
On the Create bucket screen name the bucket ('deepkt-flowlogs' in our case):
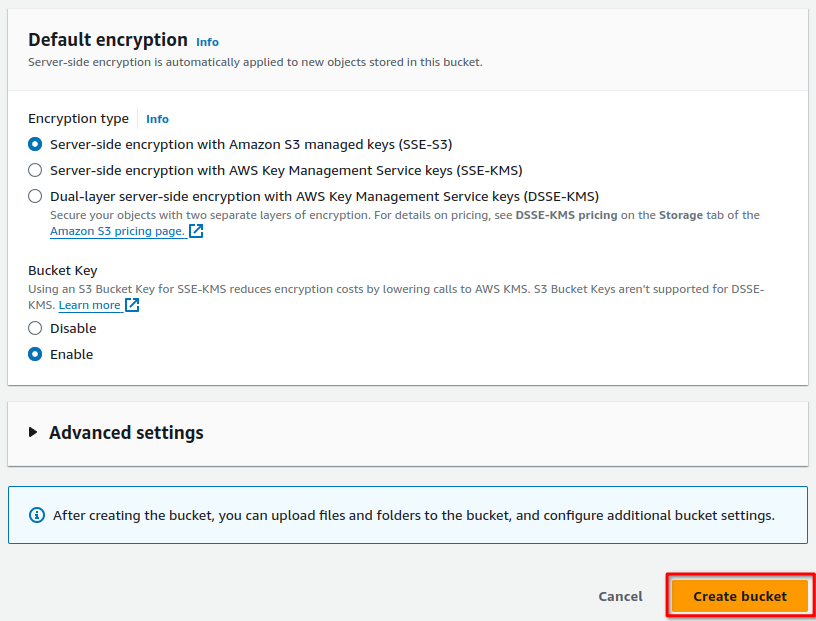
Leave the default encryption settings as is (Server-side encryption with Amazon S3 managed keys SSE-S3 and Bucket Key Enabled), then click Create bucket:
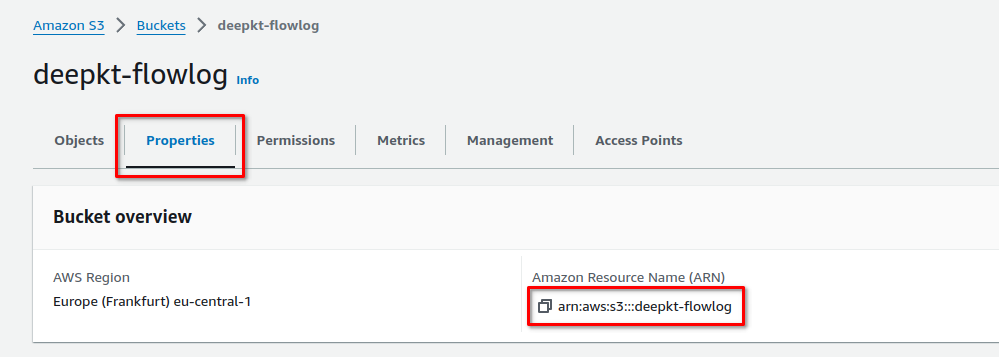
Next, go to the Properties tab under the bucket information section, find the Amazon Resource Name (ARN), and copy it:
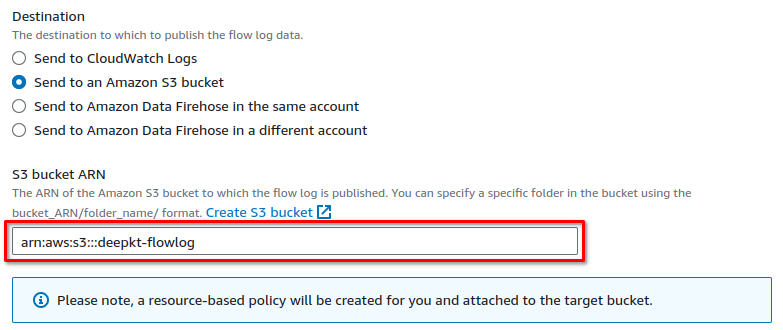
Now, we can paste the S3 bucket ARN in the destination settings:
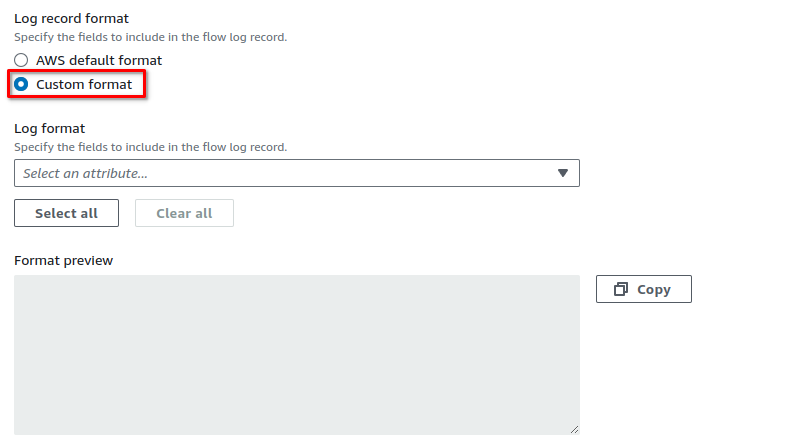
In the Log record format section, select Custom format:
Next, add the following custom attributes to the default fields: tcp-flags, type, flow-direction and traffic-path:
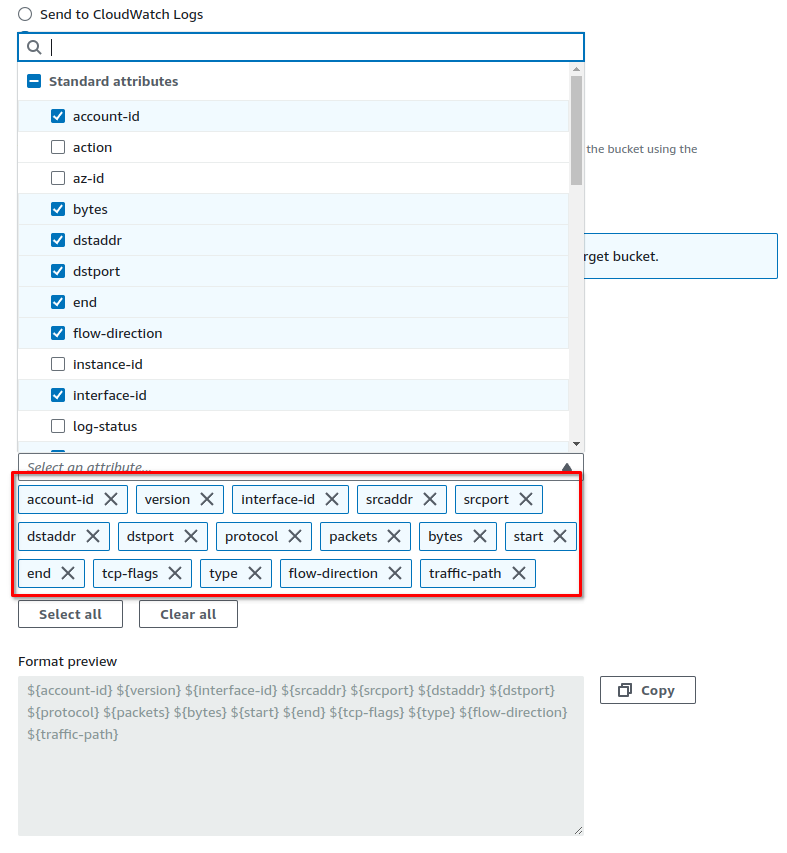
Now, the format preview should resemble this: ${account-id} ${version} ${interface-id} ${srcaddr} ${srcport} ${dstaddr} ${dstport} ${protocol} ${packets} ${bytes} ${start} ${end} ${tcp-flags} ${type} ${flow-direction} ${traffic-path}
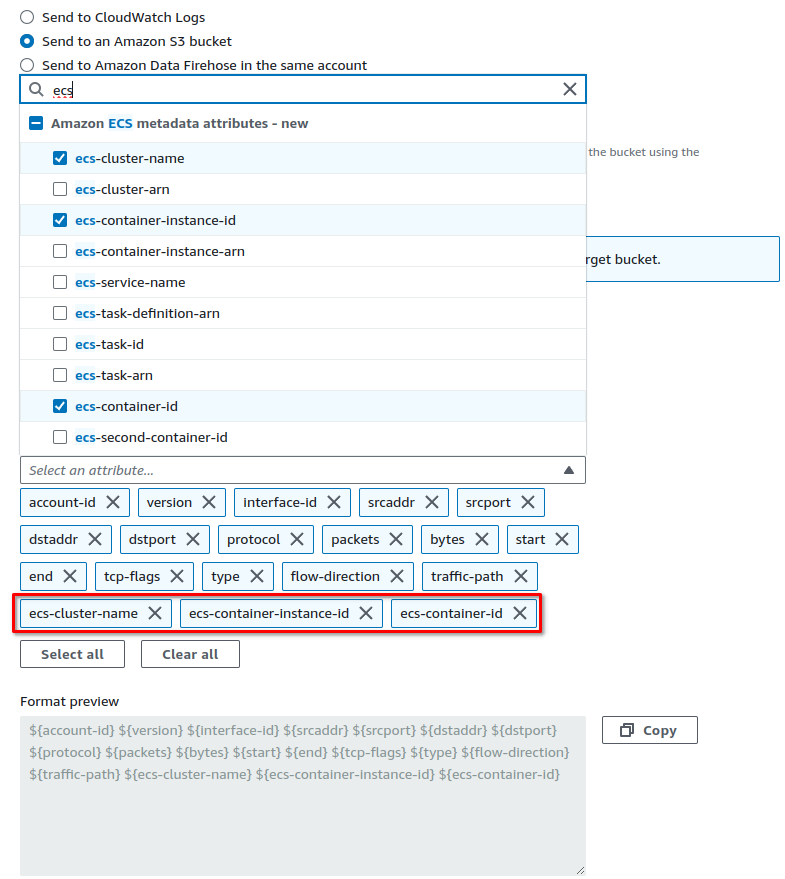
If you're using Amazon Elastic Container Service (ECS), be sure to also include the following fields: ecs-cluster-name, ecs-container-Instance-Id and ecs-container-Id:
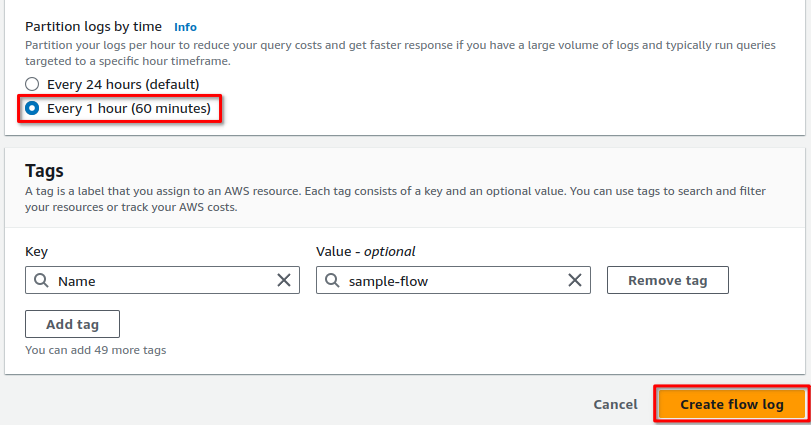
Next, under Partition logs by time, select Every 1 hour, then click Create flow log:
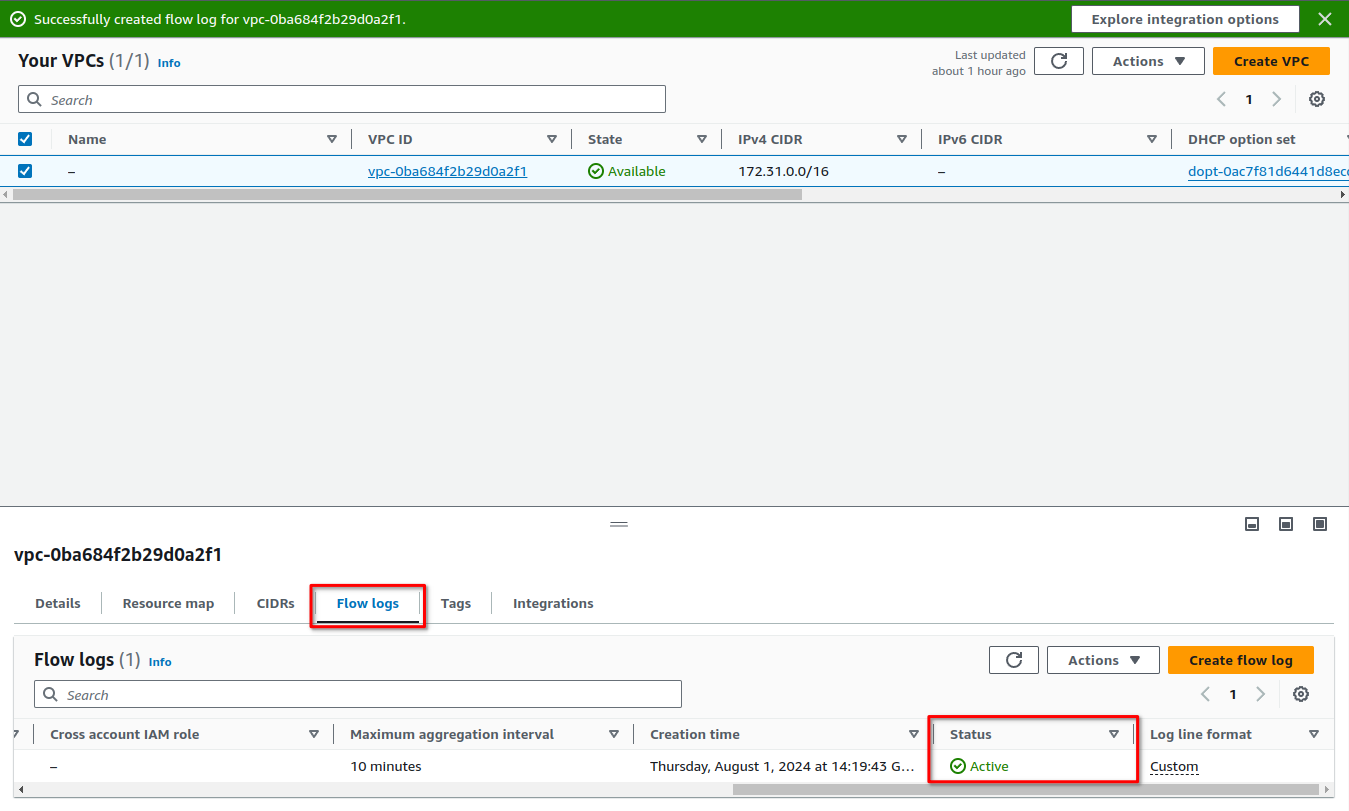
Once complete, you should see an active flow log listed under the Flow logs tab in your VPC information:

With everything configured, you can now view your flow log records in the S3 service. Keep in mind that it may take up to ten minutes for all the logs to be loaded into your S3 bucket, so be patient. Open the Amazon S3 Console, select your bucket to access its details, and navigate to the folder containing the log files:

A typical path should look like this: prefix/AWSLogs/account_id/vpcflowlogs/region/year/month/day/
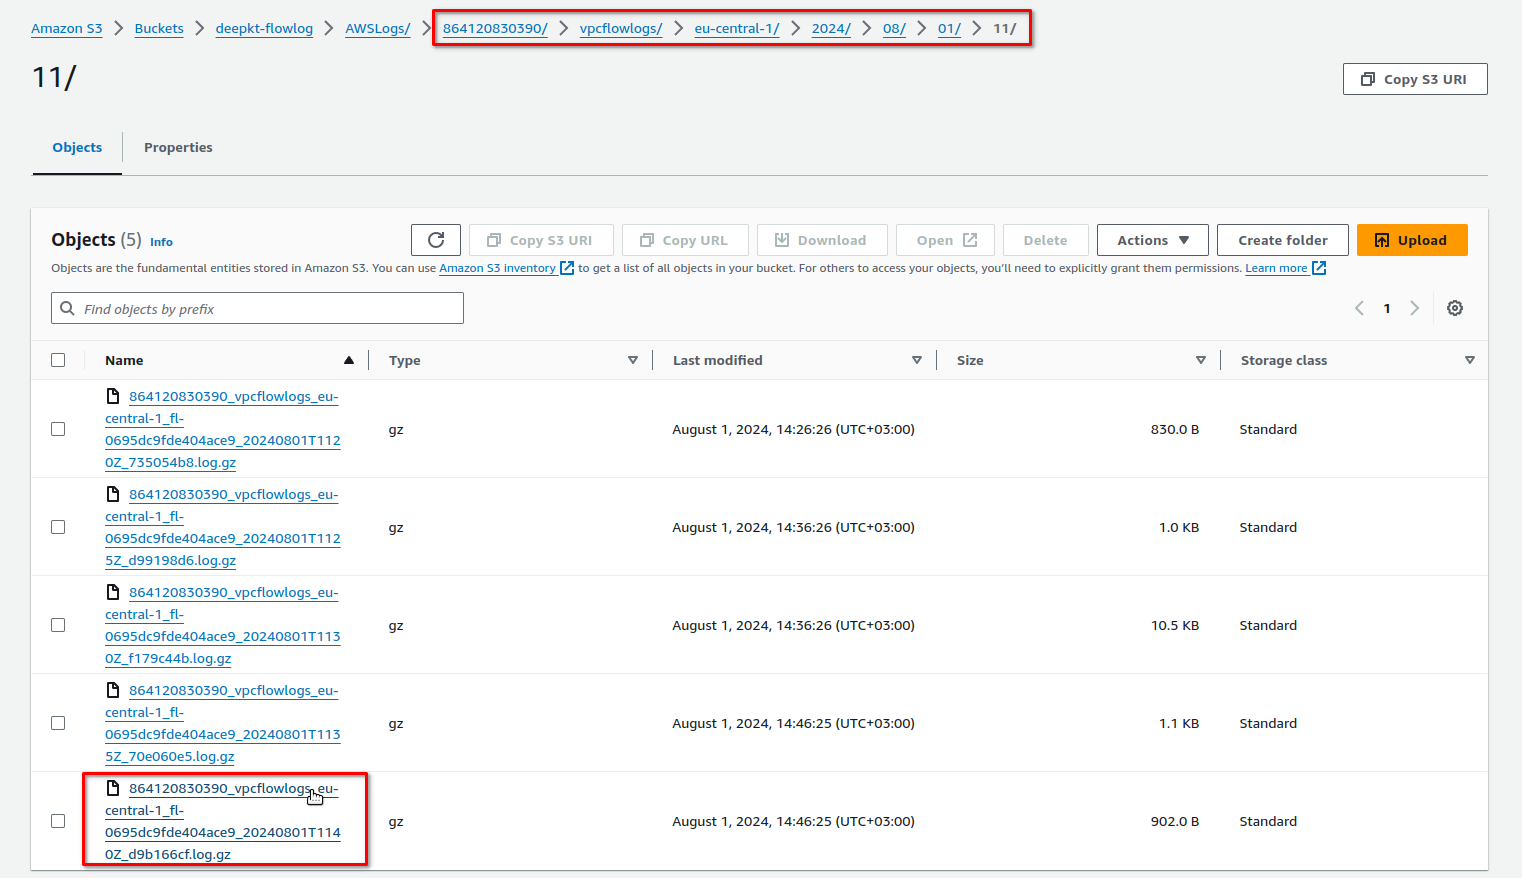
Each file represents a time window of approximately 10 minutes and is gzipped. Select the checkboxes next to the files you want to analyze, then choose Download:

Here’s an example of what a typical flow log file looks like (use zcat to extract and view the contents):

To extract the contents of the gz file, you can use any archive manager
installed on your system, or simply run gzip -d [filename] in a Linux or macOS
terminal:

Important: New flow logs will continue to be generated unless you disable them, which can be beneficial for ongoing analysis and future threat detection. Consider whether you want to keep generating these logs for future analysis or if this was a one-time effort. Remember, while the service is relatively inexpensive, it is not free.