Quick Guide
- Launch terminal (Launchpad -> Terminal)
- Choose the capture interface:
Usenetstat -nr | grep defaultto find which interface has the Default Gateway configured. Take note of the interface's (device) name. - Run the following command to capture network
traffic:
sudo tcpdump -vni <interface-name> -s 0 -w <filename.pcap> -c 100000- <interface-name>: Interface name, ex: en0
- <filename.pcap>: Output filename, ex: capture.pcap
- 100000: Number of packets to capture (roughly equivalent to 100MB)

Detailed Guide
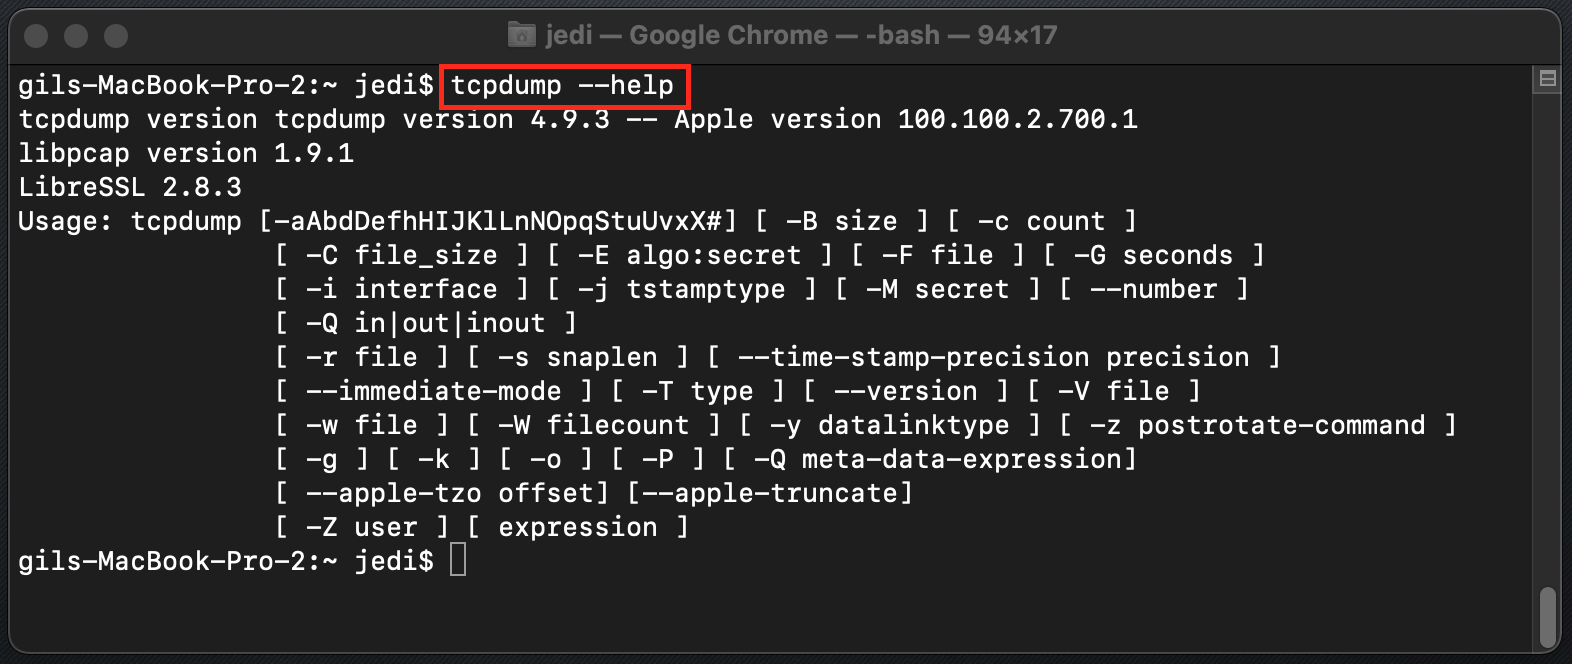
If you're using macOS, you already have everything you need to capture network traffic, as it has included tcpdump since the early '90ss. Tcpdump is a command-line network traffic capture and analysis tool that was released in 1988. It is available for most Unix-like operating systems, such as Linux, macOS, FreeBSD, OpenBSD, Solaris, HP-UX, AIX, and OpenWRT (the router OS). Tcpdump uses libpcap library to capture packets and natively supports the pcap capture format.

If, for some reason, you prefer to avoid the command-line interface, you can install the Wireshark package to capture network traffic and much more, but that should be the subject of a completely different post. (Download link here: ARM / Intel CPU). For the rest of this guide, I'll assume you are comfortable working with a macOS terminal.
To open the terminal, click the Launchpad icon  in the
Dock, type “Terminal” in the search field,
then click Terminal. Alternatively, in the Finder
  , open the /Applications/Utilities
folder,
then double-click Terminal.
Selecting the right capture interface
Although tcpdump can capture traffic from all interfaces simultaneously, I strongly advise against this practice unless the suspected traffic could appear on multiple interfaces. This scenario might occur if you are capturing traffic on a gateway device, where traffic crosses the OS while originating at one interface and is routed through another. However, it is unlikely that your Apple device is your network's gateway, so it is safe to skip this for now.
Type netstat -nr | grep default to find the device name:

The netstat -nr command lists all routes configured on the host. The default gateway route always starts with the word 'default,' followed by the default gateway IP address (e.g., 172.16.0.254) and the local interface (device) that is connected to the same network/subnet (e.g., en0).
Under normal circumstances, there should be only one interface for which the default gateway is configured. However, as you can see, my MacBook has two tun interfaces configured for VPN networking, but these are not where my suspected traffic goes through. If you find no default gateway (which means you cannot route traffic outside) or if you find multiple default gateways configured and cannot determine which interface should be sniffed, you might need to perform several separate captures and analyze all of them. A good starting point would be a non-tun interface, preferably one with an IPv4 address (the 'fe80::..' addresses are IPv6).
Using tcpdump like a Pro
- High privileges: Capturing network traffic requires root privileges on all
operating systems. You can either switch to the superuser using the
sudo sucommand or simply add sudo before the tcpdump command:sudo tcpdump. - Select the Interface(s) to Capture Packets on: Use the -ni <device> option to select the interface for capturing packets. For example, -ni enp5s0 in my case. As mentioned before, tcpdump can capture traffic from all interfaces by specifying -ni any, but I suggest avoiding that for this use case. Note that the n flag is not related to interface selection but rather instructs tcpdump to avoid IP-to-name resolution, which can slow down the capture process.
- Packet Size: For capturing forensic-grade network samples that could later be used for layer 7 protocol analysis, deep packet inspection (DPI), and file and data extraction, you should capture full packets instead of the common “storage-friendly” first 64/128 bytes of each packet. This is done by specifying -s 0 (where 0 equals unlimited). If not specified, the default packet capture size is 256 KB. Older versions of tcpdump had different default capture sizes (64/96 bytes), so I suggest explicitly setting this option.
- Capture Size: Depending on network usage and load, network captures can
quickly grow to large sizes, potentially filling up local storage, congesting networks when
transferred to remote locations, and overwhelming CPUs during analysis. On the other hand,
small captures might miss intermittent network communications. Tcpdump supports limiting the
total number of captured packets by specifying -c ### for the total number
of packets to capture. For example, -c 100000 limits the capture to 100,000
packets.
Note: Tcpdump does not natively support limiting the capture by size directly (it does, but only with the built-in capture rotate mechanism). However, the -c flag is a sufficient alternative. Assuming an average packet size of 1,000 bytes, 100,000 packets would translate to approximately 100 MB on disk (actual size may vary based on specific traffic). - Set Capture Filename: Use the -w <name> option to set the capture filename.
- Verbose output: When saving a capture to a file with the -w flag, tcpdump does not show any progress indication. Adding the -v flag increases verbosity, causing tcpdump to count and print the number of packets captured so far.
- Additional Flags and Options: tcpdump has evolved significantly since the early '90s and supports a wide variety of capture and display options, including full BPF filtering for TCP, UDP, ICMP, IGMP, IP, and Ethernet protocol fields as well as specific addresses and subnets. Exploring advanced tcpdump flags and options could easily fill another post.
- Check actual capture size: You can always open another terminal and list
the capture file with
ls -lh. A useful trick is to watch the changing file size until it reaches the desired target using the watch command, like this:watch 'ls -lh capture.pcap'. You can stop the capture at any time by pressing Ctrl + C.
Here’s how I would perform a full-packet capture of 100K packets with tcpdump:
sudo tcpdump -vni <interface-name> -s 0 -w <filename.pcap> -c 100000
Here’s my command with:
- Packet size: 0 (unlimited)
- <interface-name>: enp5s0
- <filename.pcap>: sample.pcap
- Maximum packets to capture: 100,000

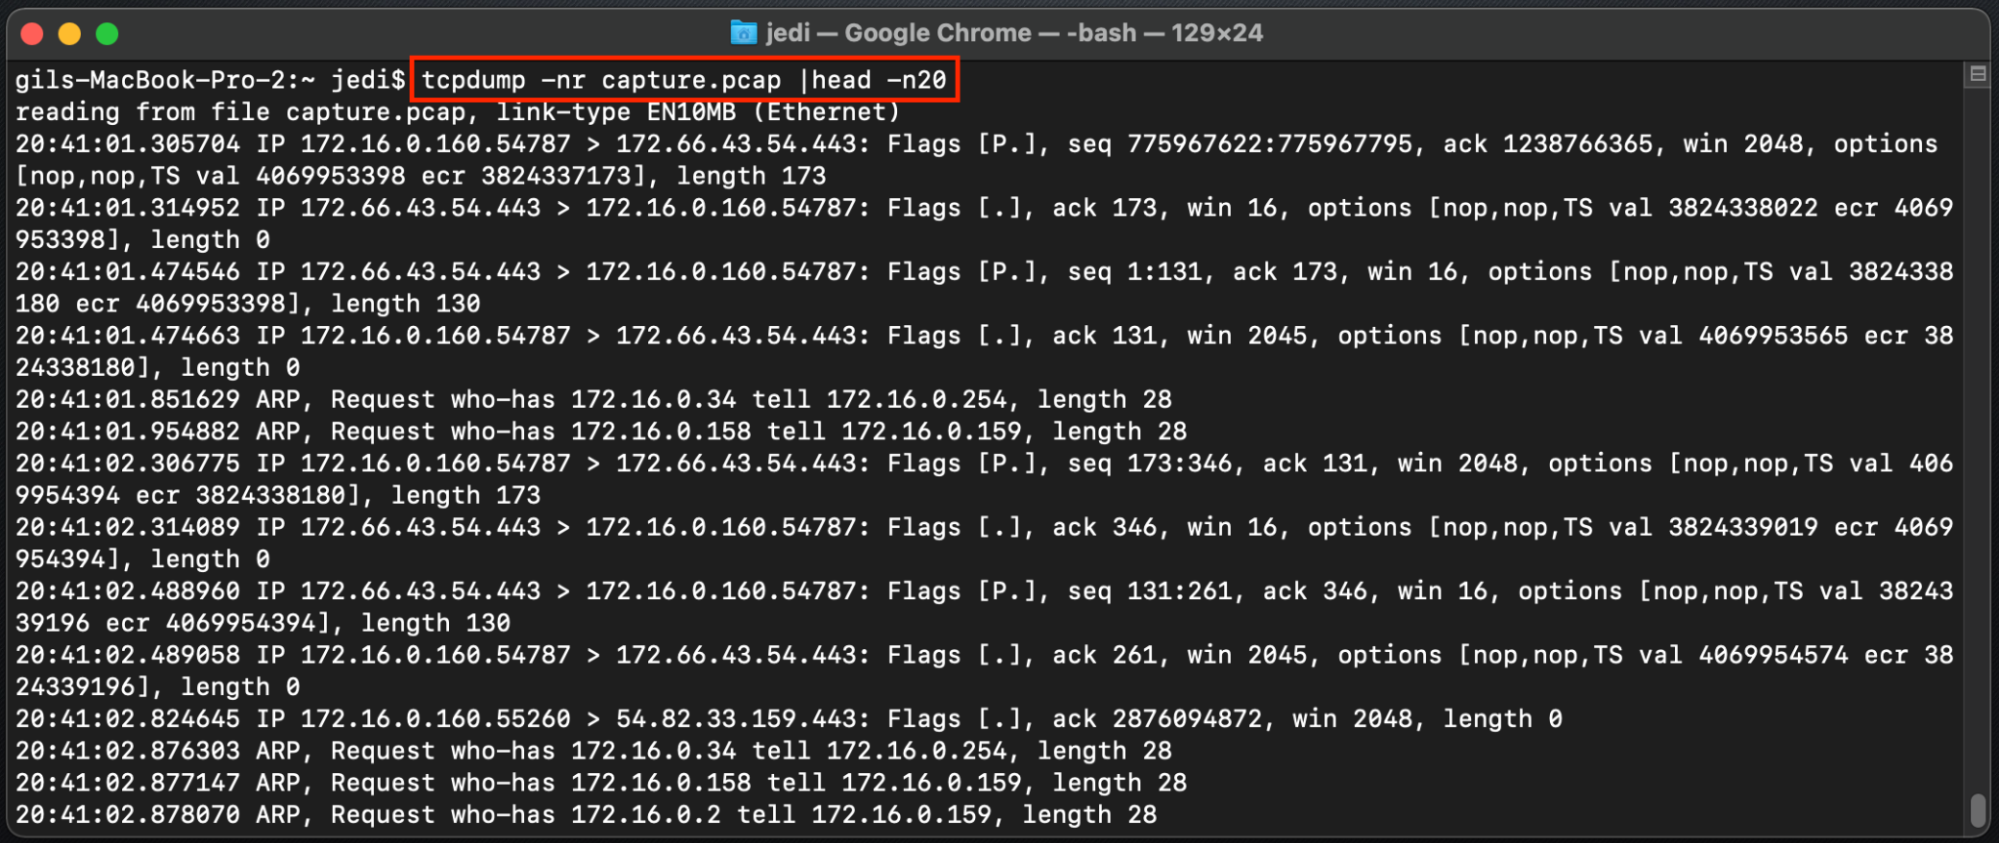
You can now verify that the capture was performed correctly by reading and parsing it with the
tcpdump -nr sample.pcap command. To limit the output to the first 20 packets, you
can use head
-n 20. Alternatively, you can pipe the output to other tools such as
less, which allows you to
scroll through the entire capture, or wc -l, which lets you count the captured
packets.

Voila, we got our forensic-grade pcap capture using tcpdump!
Getting error messages from tcpdump? See this list of Common tcpdump Errors and Solutions.
Now that you have your PCAP file...
Did you know you could use it to to discover malicious activity, security vulnerabilities and other interesting network events?

