Step By Step Guide to using pktmon and etl2pcap
Contrary to common belief, you do not need any special tools to create PCAP files. Windows has
had an integrated network capture tool that can save
captures in the PcapNG (PCAP Next Generation Dump File Format) since late 2018
in Windows 10.
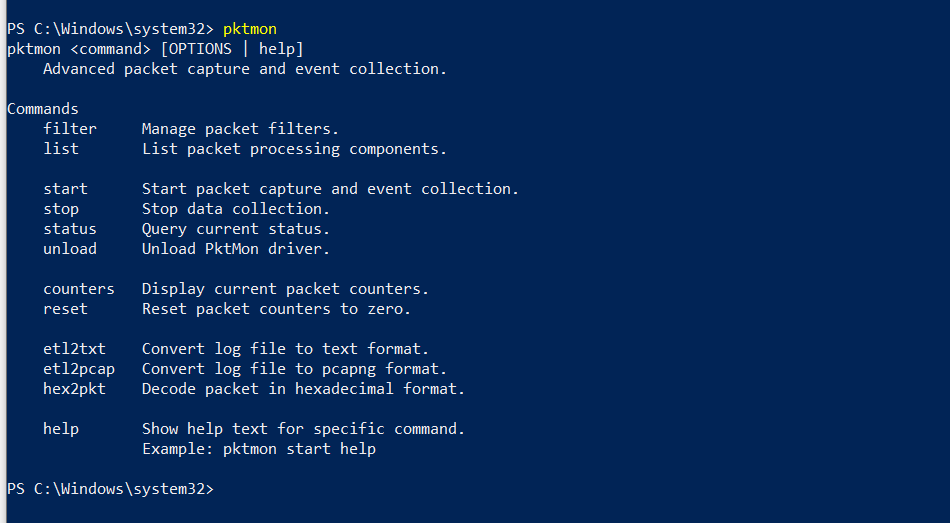
It’s a command-line tool called Pktmon (Packet Monitor).

Prior to Pktmon, one would either use netsh trace (Windows 8 era), Microsoft Message Analyzer
(mid-Windows 7 era) - a GUI tool that had a very brief appearance - or the ancient netmon
(Windows 2000/2003). All of these shared the same limitation of not being able to store the
capture in a standard, open, or otherwise widely-supported format (like Pcap/PcapNG).
Until the appearance of Pktmon, I couldn’t help but recommend anyone using Windows to download a
third-party tool for the task, specifically WinDump, which is as close as it gets to tcpdump for
Windows (still available here) and runs on all Windows
versions since Windows 95. Microsoft did, however, provide a tool to convert their proprietary
ETL format to PcapNG at some point during 2019 (still available here).
Getting started and picking the capture interface
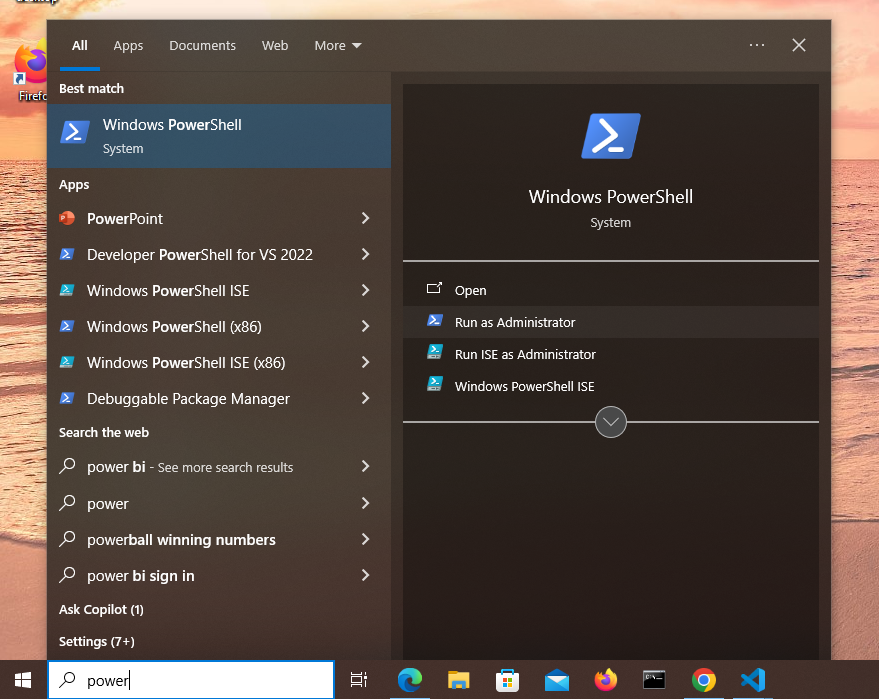
To capture network traffic in Windows 10/11, we need to open either the Command Prompt (CMD) or
(the much-preferable) PowerShell with administrative permissions. If you type ‘power’ at the
Start menu search you’ll see a ‘Run as Administrator’ option on the right pane (press ‘Yes’ on
the User Account Control pop-up):

Next, let’s pick the network interface you want to ‘sniff’. Although Pktmon can capture traffic
from multiple interfaces simultaneously, I would strongly advise to avoid that unless the
suspected traffic can appear on several interfaces (this could happen if we capture traffic on a
gateway device, but the chances that your gateway device runs Windows OS are next to
impossible).
Type pktmon list to show all available interfaces for network capture.

If you already know what interface to use for capture and recognize it from the list - good for
you - take note of the interface number in the ID column (in my case, the adapter with ID 10).
Now, if you cannot match an interface from this list to the desired capture interface, or if you
don’t even have an idea which is the desired capture interface, type the command
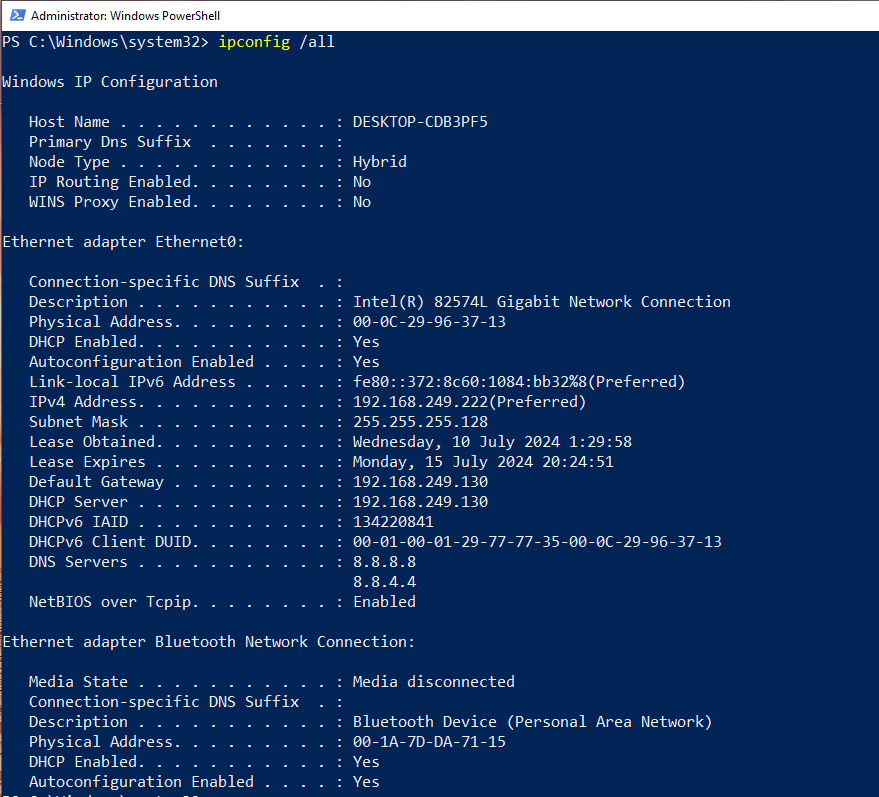
ipconfig /all
to list all interfaces along with their IP and MAC addresses, along with DNS and default gateway
settings:

Under normal circumstances, there should be only one interface for which default gateway is
configured; in the above example, the default gateway address is
192.168.249.130, and it is
configured on the Ethernet0 interface (the default gateway address indicates that this is the
interface that can communicate with the outside world).
Now, this interface has its MAC address listed under Physical Address (in this case, it's
00-0C-29-96-37-13) and this same address should be listed in pktmon’s device
list (MAC Address
column) as well. Take note of the ID that has the same MAC address.
Using MS Packet Monitor (Pktmon) like a Pro
- Start Packet Capture: The command
pktmon start along with the
-c flag will start packet
capture. For example: pktmon start -c. (Don’t stop reading here as Pktmon
supports more
fine-grain control over various significant settings.)
- Select the Interface(s) to Capture Packets On: This is done with
--comp <id>. For example:
--comp 10 in my case. As mentioned before, Pktmon can capture traffic from
multiple
interfaces (by specifying --comp id1 id2 etc.) or even capture traffic on all
network
interfaces (by specifying --comp nics). Notice that Pktmon’s default setting is
to
capture on all available components, but I suggest avoiding such captures unless there
is no other (better, more specific) alternative.
- Size Matters #1 - Packet Size: Capturing forensic-grade network samples
that could later be
used for layer 7 protocol analysis, DPI (deep packet inspection), and file and data
extraction means we should capture full packets (vs. the common “storage-friendly” 64/128
first bytes of each packet). This is done by specifying
--pkt-size 0 (where 0
equals
unlimited). If not specified, the default packet capture size is 128 bytes.
- Size Matters #2 - Capture Size: Depending on network usage and load,
network captures can
quickly grow to gigantic sizes, and as such they can fill up local storage, congest networks
when transferred to remote locations (like uploading them to an online analysis service),
and choke even the mightiest CPUs when analyzed. On the other hand, small captures could
miss network communications that aren’t always active. Pktmon supports limiting the total
capture size by specifying
--file-size ### (or -s ###) for the
maximum capture size in
megabytes. For example: -s 100 would limit capture size to 100MB. If not
specified, the
default capture size is 512MB.
- Set Capture Filename: Set the capture filename with the
--filename <name>
option (or -f
<name> in short form). If not specified, the default file name is
PktMon.etl. Notice
that Pktmon will still capture in Microsoft’s proprietary ETL file format. Later, we
shall convert it to PcapNG using Pktmon.
- Logging Strategies: What happens when the capture file reaches its maximum
size? Pktmon
supports four different logging strategies: circular, multi-file, memory, and real-time. I
find two of these relevant for our use case: circular and multi-file.
- Circular: Overwrites the oldest events once the log reaches its
maximum size.
- Multi-file: Creates a new capture file each time the file reaches
maximum size, thus it has
no limit on the number of captured events.
- Specify the logging strategy with
--log-mode <strategy> (or
-m <strategy> in short form).
For example: -m multi-file would set the multi-file strategy. The default
strategy
is circular.
- Additional Flags and Options: Pktmon supports many more flags and options,
but what we’ve
covered so far is all we need to know to produce forensic-grade network captures in Windows.
If you wish to check more options, just type
pktmon help to list all top-level
commands and
pktmon <cmd> help to list each command's detailed options and flags.
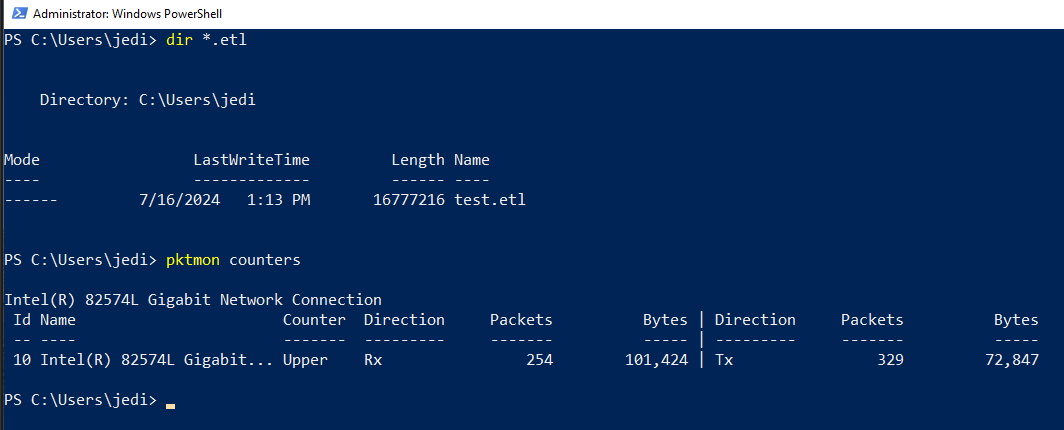
- During Capture: You can check the file size of the output file using
ls or
dir. If you need
more detailed information, such as transmitted and received packets and bytes, run
the command pktmon counter (see screenshot below). When you wish to stop the
capture, just
run pktmon stop. Remember, unless specified otherwise, Pktmon will start
writing new events
over old ones since the default logging strategy is circular.

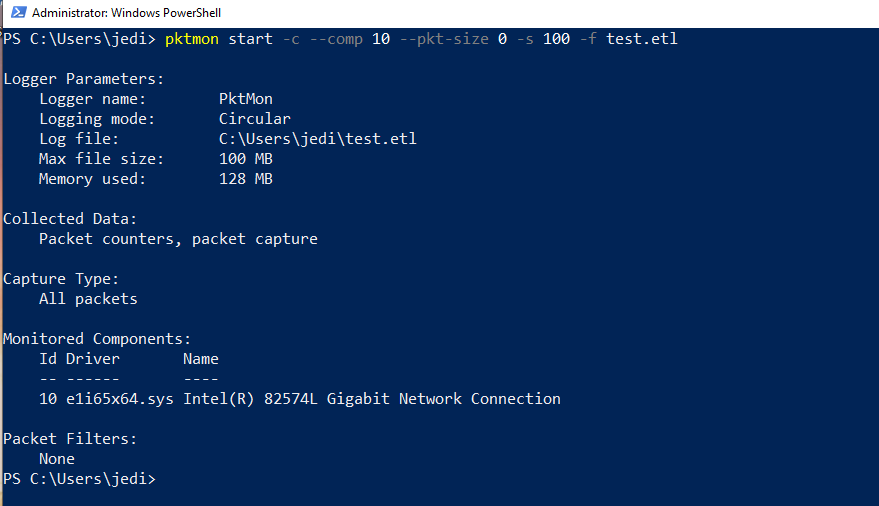
Here’s how a circular full-packet capture of maximum 100MB would look:
pktmon start -c --comp <id> --pkt-size 0 -s <#MB> -f <filename.etl>
Here's my command, with the following parameters:
- Interface ID: 10
- Full Packet Capture
- Max Capture Size: 100MB
- Output Filename: test.etl

Convert sample into standard format (PcapNG)
Assuming that network capture has finished (by typing the pktmon stop command), the
last part of the procedure is to convert the ETL capture file to PcapNG, which is supported by
every network tool out there. Pktmon has a built-in ETL to PcapNG converter.
Command syntax: pktmon etl2pcap <filename.etl> --out <filename.pcapng>

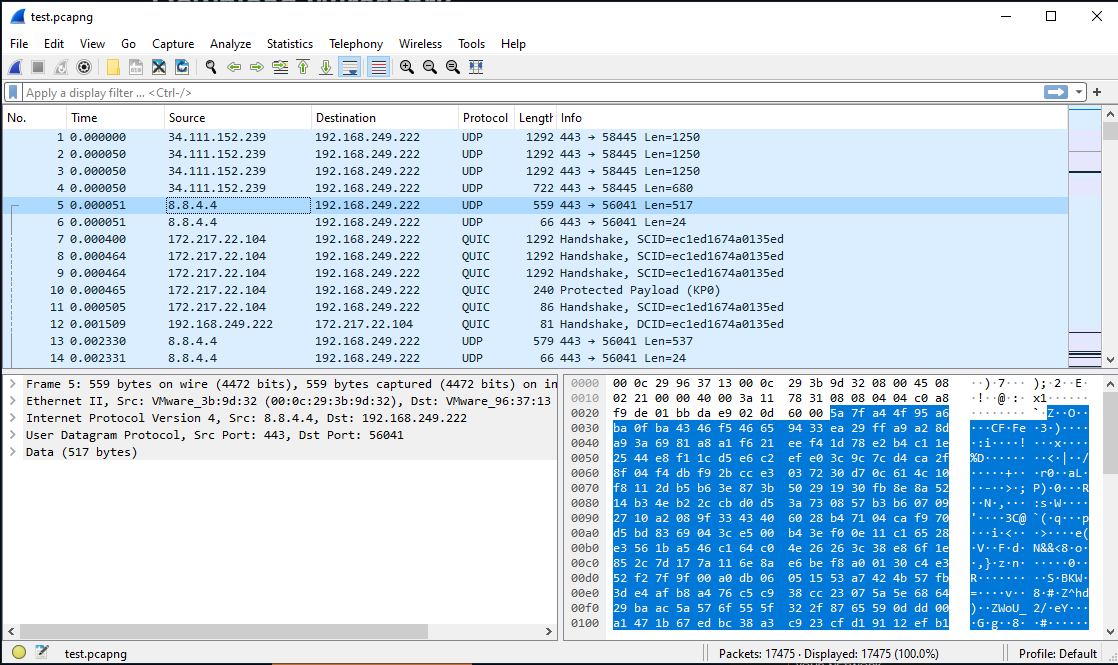
Voila, we got our forensic-grade PcapNG capture using pktmon!
