Red Hand Analytics
Data Flows
Trace inbound, outbound, and internal transfers and identify unusually large exchanges.Data Flows summarizes traffic volume by direction and helps identify endpoints responsible for unusually large transfers.
Data flow summary
The summary divides traffic into:
- Total data exchanged across the report.
- Outbound data from internal to external endpoints.
- Inbound data from external to internal endpoints.
- Internal data exchange between internal endpoints.
The totals depend on correct internal and external classification.
Top uploaders and downloaders
Top uploaders ranks endpoints that sent the most data. Top downloaders ranks endpoints that received the most. Direction filters let you narrow the ranking without removing the widget when there are no matches; an empty-state message explains that no results match the current filter.
Select View to open the relevant Activity List or Connections view with the endpoint context applied.
Timeline
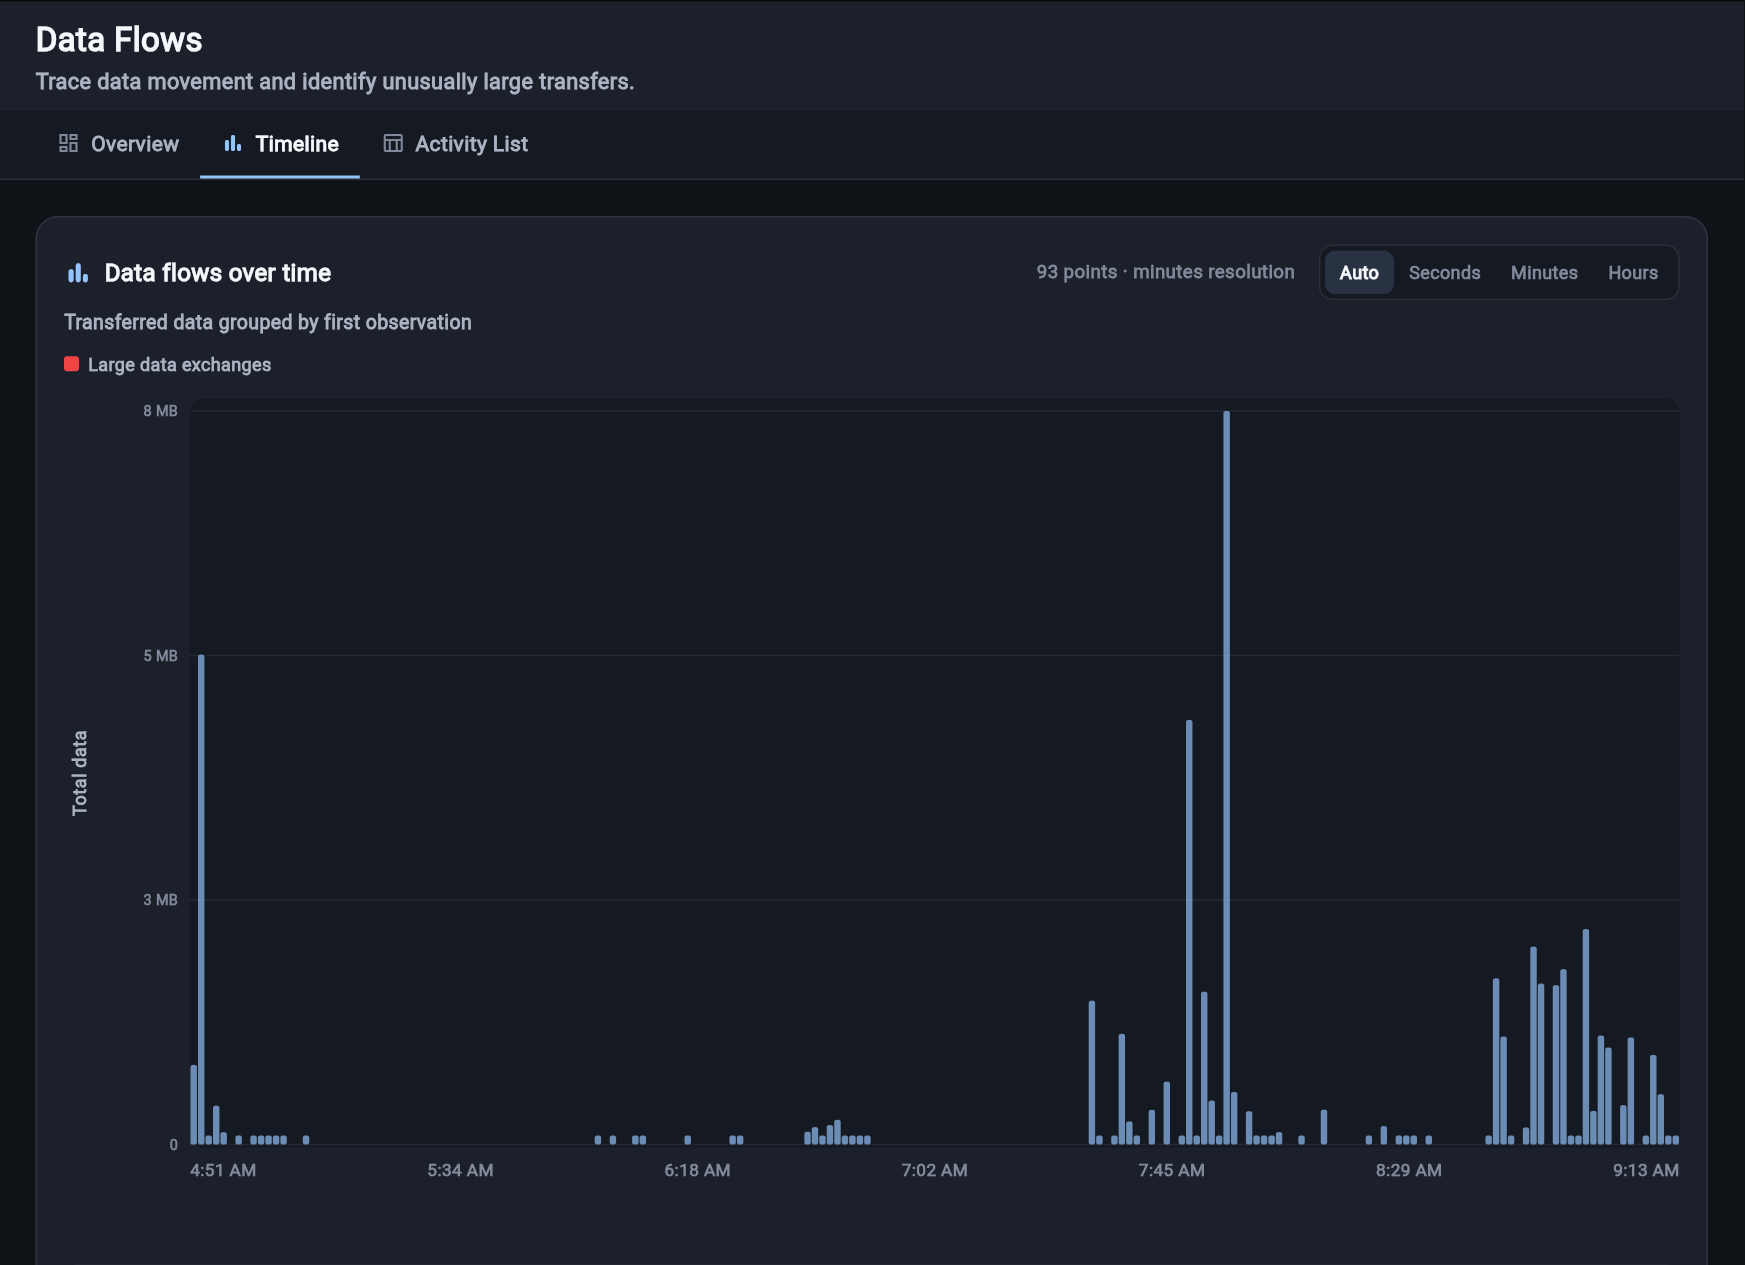
Timeline plots transferred data by first observation. Large spikes deserve context: backups, software distribution, media, and normal synchronization can all be legitimate. Select a point or drag across the chart to focus the list on a timeframe.
Activity List
The list explains which detected activities account for the transfer. Use the same preset-filter bar, dropdown filters, sorting, and Show all behavior available in DNS Requests and other list screens.
Investigate a large transfer
- Identify the internal endpoint and direction.
- Open its connections and compare upload with download.
- Check the target domain, ownership, and threat intelligence.
- Review timing, repetition, service, and process information when available.
- Confirm whether the volume and destination fit the endpoint's expected role.
See it in context