Red Hand Analytics
DNS
Inspect resolvers, unresolved requests, noisy clients, data exchange, and conflicting answers.DNS brings resolver usage, failed lookups, response conflicts, and DNS traffic volume together with the clients and requests behind them.
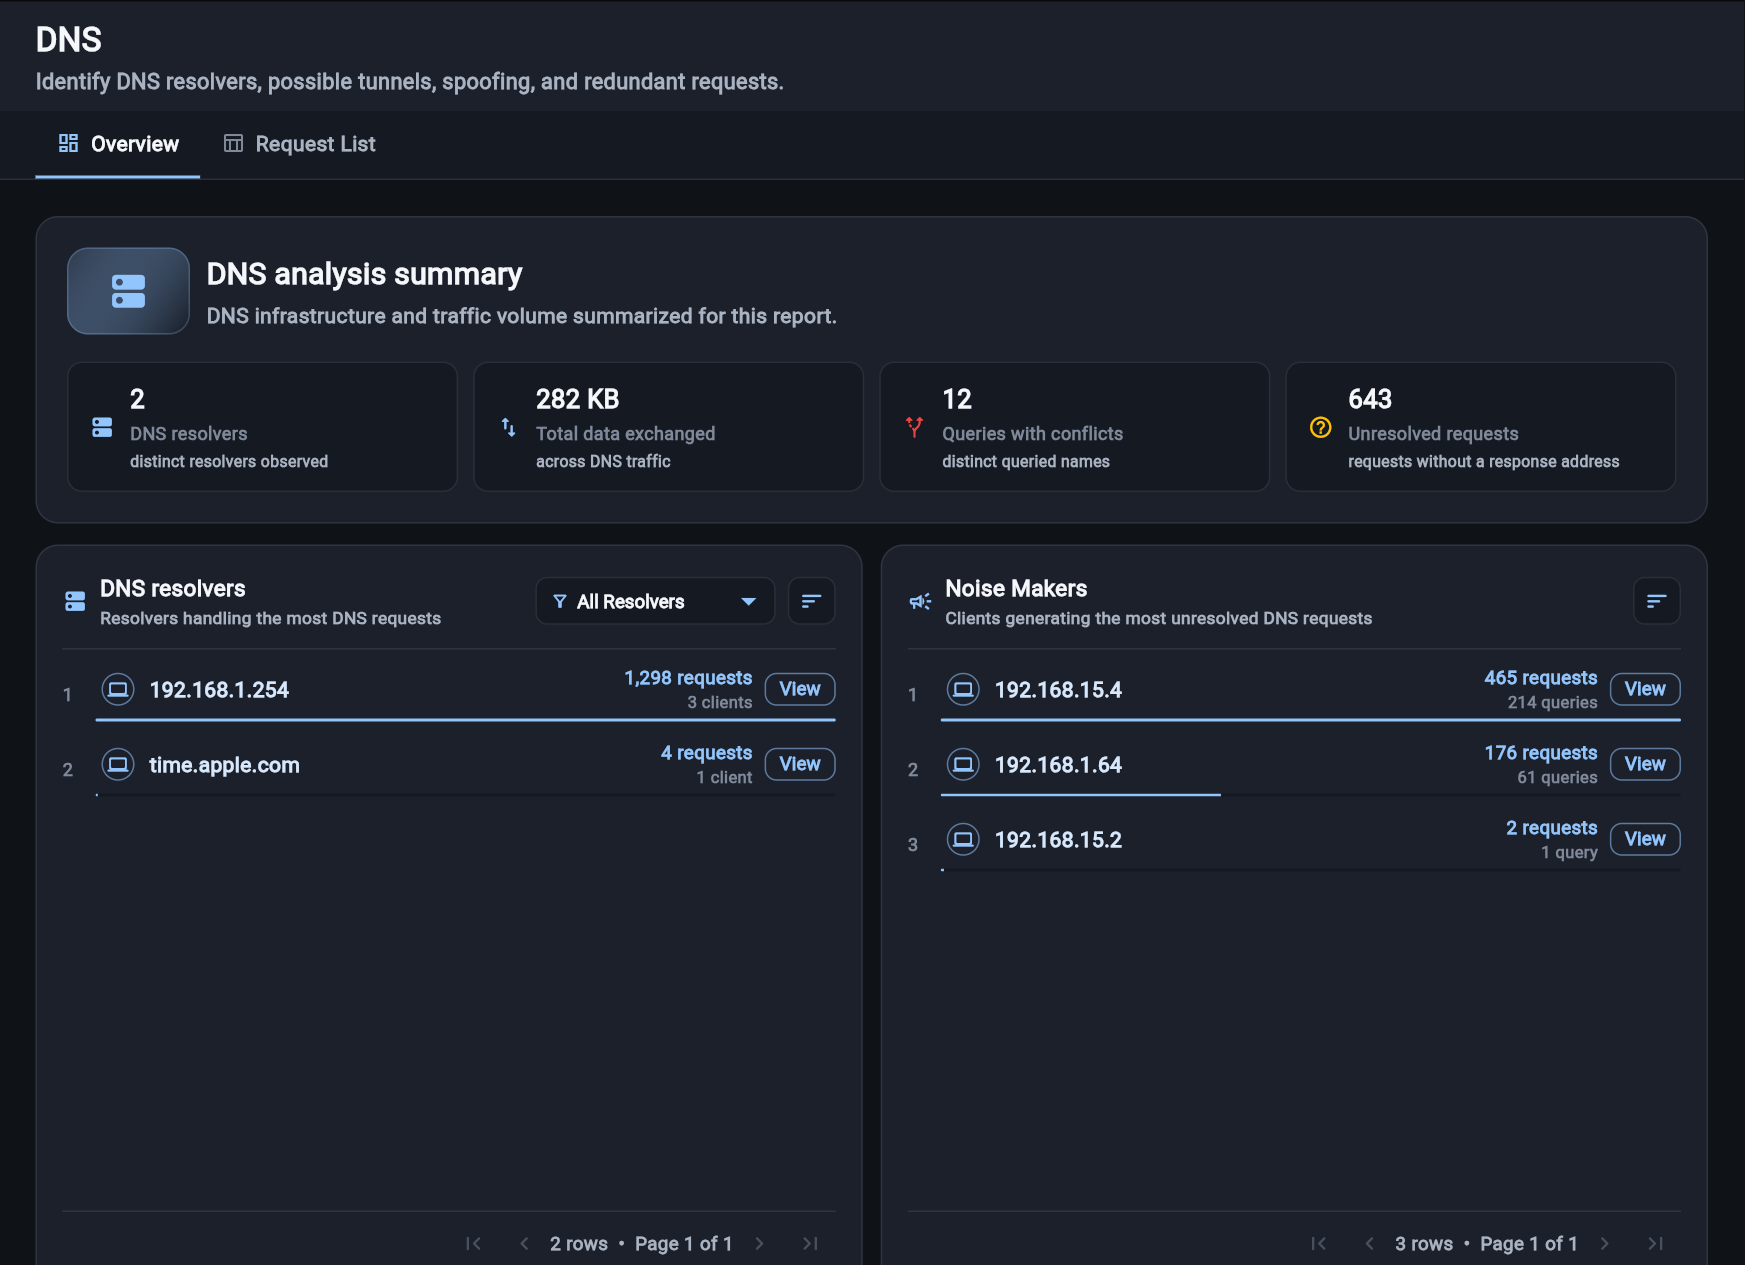
Summary metrics
The top summary reports the number of DNS resolvers, total DNS data exchanged, queries with conflicting responses, and unresolved requests. DNS analysis is based on traffic using destination port 53 and excludes DNS record types that are not useful to the ranked request widgets.
DNS Resolvers
DNS Resolvers ranks the resolvers handling the most requests. Requests is the primary metric and distinct clients is secondary. Use the internal or external filter to understand whether clients use approved infrastructure or unexpected resolvers.
Noise Makers
Noise Makers groups unresolved requests by initiating client. A high request count can indicate a configuration problem, stale software, a search-domain issue, or automated domain generation. Select View to open the matching DNS requests.
Data exchanged in DNS requests
This widget groups traffic by client and queried top-level domain. It shows total data as the primary metric and average bytes per second as the secondary metric. Sorting uses total data by default, and the bar also represents total data.
Large or sustained DNS data exchange can justify checking for tunneling, but volume alone is not proof. Review query names, record types, direction, timing, and the responsible client.
DNS queries with conflicting responses
This widget identifies query names that received different response addresses within a short time window. The metric is the number of conflicting addresses. Legitimate load balancing and content delivery can produce multiple answers, so compare timing, resolver, client, TTL, and reputation.
Unresolved requests
Unresolved Requests groups unanswered or empty responses by query name and shows request and client counts. Repeated failure across many clients often points to infrastructure or configuration; failure from one client may be application-specific.
Request List
Request List opens by default with all DNS requests or with preset filters from a widget. It includes time, client, resolver, query, record type, response, data, and relevant flags. Domain and resolver dropdowns show both a hostname and IP address when both exist.
Select a domain icon to open a focused threat-intelligence dialog. View Requests carries client, resolver, query, top-level-domain, or conflict context into the list.
Limitations
Encrypted DNS is not visible as conventional port 53 requests. A packet capture can also miss responses, making some requests appear unresolved. Validate suspicious DNS behavior against endpoint and connection evidence.
See it in context